Dashboard
Dashboard Overview
The dashboard is your Executive Summary. Instead of checking 10 different reports, you get a consolidated view of your institute's Admissions, Academics, and Daily Operations here.
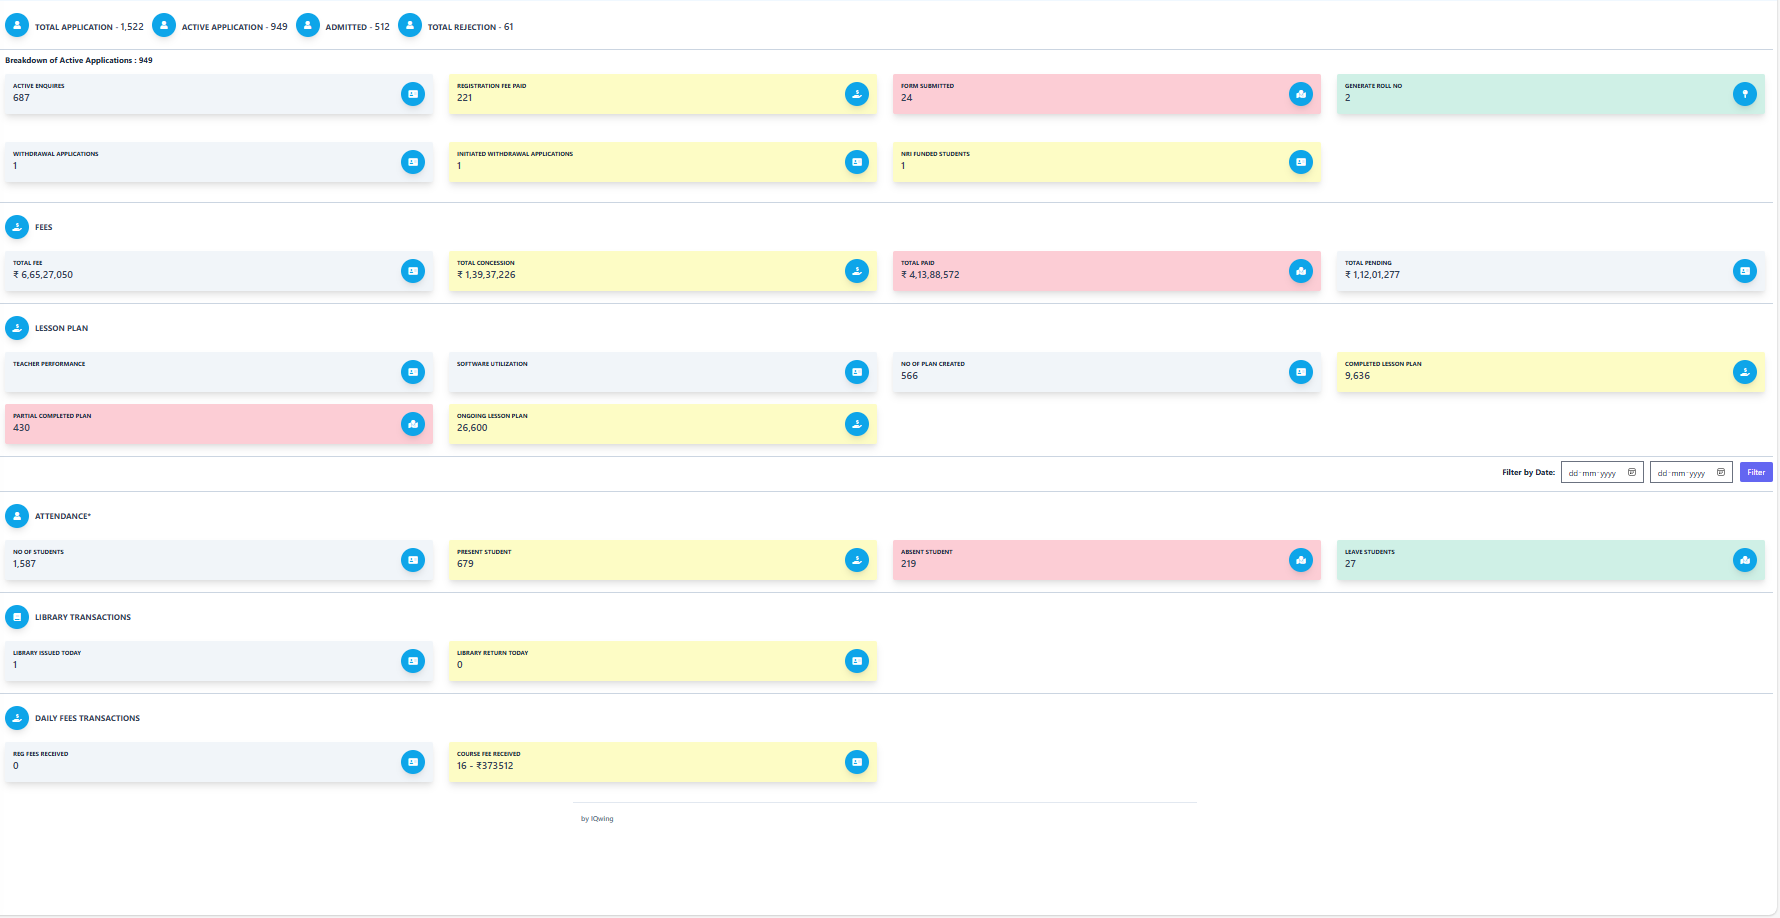
1 Active Applications Pipeline
What is this? This shows the journey of a student from "Just Interested" to "Fully Admitted". The total count (949) represents all students currently in this pipeline.
Breakdown by Stage
Students who have filled the enquiry form but have NOT paid the registration fee yet.
Action: Call them to follow up on payment.
Registration fee received. They can now access the full admission form.
Action: Guide them to fill the detailed form.
Student has filled all details and uploaded documents.
Action: Admin needs to verify documents and approve.
Admission Confirmed! These students are now part of the institute database.
🚩 Withdrawal Applications
Students requesting to cancel admission.
⏳ Initiated Withdrawal
Withdrawal approved by admin but pending No Dues Clearance (Library/Hostel).
🌍 NRI Funded
Monitor these separately as their fee structure is often in USD/Foreign Currency.
2 Lesson Plan Tracking (LMS)
Planned topics for semester
Topics finished in class
Topics currently being taught
Topics yet to start
Teacher Performance Metrics:
- No of Class Allocated: Total lectures assigned to a teacher.
- Lesson Content Added: Has the teacher uploaded study material (PDF/Notes)?
- Attendance Marked: Did the teacher mark attendance for the scheduled class?
📊 Understanding Your Daily Metrics
A detailed breakdown of the numbers you see every day.
Student Attendance Metrics
Total No. of Students
Total Active Enrollment.
Present Students
Physically present today.
Absent Students
Absent without leave.
Leave Students
Authorized absence.
Library Activity
Books given to students/staff.
Books returned back to the library shelf.